
CQC Requires Improvement Trend Study

Expanded sample report: 26 coded inspection and assessment reports, plus an 8-case deterioration cohort
Adult social care, England, 2023 to July 2026

Executive summary
This report expands the earlier 11-case pilot to 26 adult social care services holding an overall CQC rating of Requires Improvement, and adds a separate cohort of 8 services that fell from Requires Improvement to Inadequate. All figures carry a denominator of 26 or fewer and remain indicative rather than sector estimates. The sample's principal weakness is geographic concentration, set out in section 8.
Governance dominates, and the finding strengthened as the sample grew. A governance breach was named in 17 of 26 reports (65%), and governance or leadership concerns were coded as findings in 22 of 26 (85%). In the 12 best-evidenced cases the rate is 10 of 12.
Failure sits with systems, not care staff. Of 82 coded findings, 71 (87%) were attributed primarily to management oversight or provider-level governance, against 5 to frontline practice and 6 to workforce pressure.
Repeat failure is routine. 12 of 26 services (46%) carried at least one breach forward from a previous inspection, and 20 individual findings were coded as repeated breaches. CQC's own guidance states that repeated Requires Improvement ratings may themselves constitute a Regulation 17 breach.
The assurance gap is the mechanism. Across the strongest cases the recurring narrative is not absent governance but governance that fails to detect. One provider's audits were described as being completed without staff understanding their purpose; another's premises checks did not identify mould and hygiene risks in people's homes; a third had medicines systems in place but not embedded.
Caring holds while Safe and Well-led fail. Wherever key question detail was available, Caring was the strongest domain, including in services failing on every other measure.
Scope and method
The sample comprises services with an overall Requires Improvement rating, in England, in adult social care, with reports dated between January 2023 and July 2026. One case (RI-26) has an RI report published in October 2022; it is flagged and excluded from period-based counts but retained because its later recovery to Good is analytically useful.
Cases were discovered through indexed CQC location pages, the CQC public reports API, CQC press releases, local press reporting of published reports, and local authority scrutiny committee summaries. The CQC website itself blocks automated retrieval of search and location pages, but the public reports API returns full report text and one case (RI-15, New Age Care) was coded from a complete primary report on that route. This is the method recommended for the full study.
Every negative finding was coded to one primary theme with severity, frequency, impact, cause and status. Evidence depth is recorded per case, and a sensitivity subset of the 12 strongest cases is reported alongside headline figures so readers can see whether patterns hold on better evidence.
Aggregate findings
3.1 Failure themes
The 82 coded findings distributed across 17 of the framework's 24 primary themes, with nothing requiring the Other category. The leading themes by reports affected were: Governance and oversight (22 of 26), Risk management (11 of 26), Care planning and records (8 of 26), Staffing and deployment (6 of 26).

Coded findings and reports affected, by primary theme (n = 26 reports, 82 findings). 
Theme presence by report. The governance row is near-continuous; other themes cluster by service circumstance 3.2 Regulations breached
Counting each service's latest report and only where sources named the regulation: governance (Regulation 17, or 'good governance' in words) appeared in 17 of 26 reports, safe care and treatment (Regulation 12) in 7, consent (Regulation 11) in 4, and staffing (Regulation 18) in 3. Dignity, premises, recruitment and person-centred care appear in smaller numbers. Because several council-summary sources describe breaches without citing numbers, these counts understate true frequency and should be read as a floor.
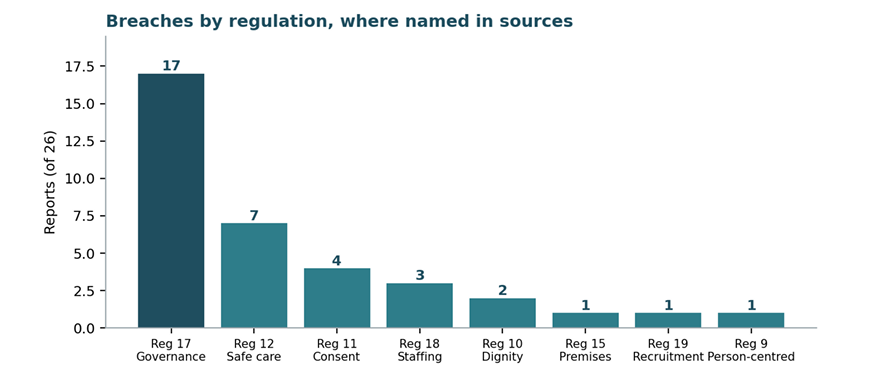
Named regulation breaches (n = 26). 3.3 Severity, impact, status and cause
Of 82 findings, 56 were high severity and 1 critical. On impact, 69 represented potential harm, 12 documentation risk and 1 actual harm. On status, 47 were new concerns, 20 repeated breaches and 15 continuing concerns.

Severity, impact and status of coded findings 
Cause attribution. Systems and leadership account for the large majority Findings in depth
4.1 The assurance gap
The defining governance failure across this sample is detection, not documentation. The clearest evidence comes from the one case coded from full report text: at a Warwickshire domiciliary agency, inspectors recorded that audits were being completed but that there remained a lack of understanding of what the audits were for and what was done with the findings. Medicines audits either were not completed or failed to identify the issues inspectors found. A serious injury was omitted from the provider's own monthly analysis, and the registered manager said they had not been aware a statutory notification was required.
The same mechanism recurs elsewhere. A supported living provider in Essex took swift action on mould, dirty carpets and cracked flooring once inspectors raised them, but its own premises checks had not identified the poor hygiene or the infection risk beforehand. A Northamptonshire home was found to have medicines systems that were either not in place or not embedded effectively, alongside oversight systems that were not completed effectively. A Greater Manchester home had management audits that had not been fully implemented or embedded, during a period of repeated management change.
This is consistent with wider sector reads. An analysis of 181 care home reports published in January 2026 (72 rated Requires Improvement, 15 Inadequate) concluded that the differentiator between ratings increasingly lies in the quality, frequency and independence of oversight rather than the presence of governance frameworks, and that training compliance is commonly tracked while competence goes undemonstrated. A review of 10 homecare Requires Improvement reports published in April 2026 found Well-led rated Requires Improvement in all 10, with audits present but not detecting what CQC found.
4.2 Repeat breaches and partial recovery
12 of 26 services carried at least one breach forward. Governance is consistently the last thing fixed. At a Stockton home, three of four previous breaches were met and Effective, Caring and Well-led all improved, yet the overall rating stayed at Requires Improvement because the governance breach persisted. A Gloucestershire domiciliary agency repeated the same three failures (risk management, safe recruitment, quality monitoring) across consecutive inspections before eventually meeting them.
The five services rising from Inadequate tell a consistent story: each had new or strengthened leadership and each exited or was progressing out of special measures, but four of the five still carried governance or safety concerns. One provider had explicitly failed to follow its own action plan, having told CQC it would meet regulatory requirements by a date that passed.
4.3 Deterioration: what happens when Requires Improvement is not fixed
The 8 services in the deterioration cohort all held a previous rating of Requires Improvement and were subsequently rated Inadequate, most being placed in special measures. Their pattern is strikingly uniform: continued breaches from the previous inspection plus a cluster of new ones. One West Midlands home carried four continued breaches and added four new ones covering person-centred care, complaints, staffing and fit and proper persons. A Cheshire nursing home carried four continued breaches and added three. In a
Wolverhampton home, CQC recorded that despite requesting an action plan at the previous inspection, leaders had not taken all the actions they said they would.
The practical reading for providers is that Requires Improvement rarely stabilises. In this cohort it either recovered or decayed, and decay took the form of the original breaches persisting while the surrounding service deteriorated around them.
4.4 Warning signs before Good becomes Requires Improvement
Seven services fell from Good. The visible antecedents cluster into four patterns. First, an incident plus historic notification failures. Second, quiet drift discovered at a routine assessment after a long gap, including a London charitable home assessed roughly eight years after its previous Good rating, where staffing themes echoed complaints made publicly four years earlier. Third, growth or novelty outpacing systems, seen in a newly founded agency and a newly opened home where staff described figuring it out as they went. Fourth, material change of service model: one nursing home rated Good as an older people's service changed to a specialist learning disability cohort and has been Requires Improvement since, with the registered manager's skills for the new specialism questioned.
Change of any kind (new service, new cohort, rapid growth, leadership churn) is the strongest candidate early-warning indicator in this sample. In one Greater Manchester case a further management change was signalled immediately after the assessment visit, during the very period the service was being judged.
4.5 What improvement looks like
Four services in the sample have a documented return to Good or to full compliance. Where a reason was recorded, leadership stability was the factor named: a council scrutiny committee attributed much of one home's recovery from Requires Improvement (with Safe rated Inadequate) to stable management, following a new manager being appointed and the service operating under an admissions embargo. Recovery timescales, where calculable, ranged from roughly one year to three years.
Case evidence summaries
One row per report. Full extraction fields, theme coding, the deterioration cohort and all source links are in the accompanying workbook.
Limitations
Geographic concentration is the main weakness. Eleven of 26 cases (42%) sit in one borough,
Stockton-on-Tees, because that council publishes unusually detailed CQC summaries in its scrutiny minutes.
Regional comparisons in this sample are therefore not meaningful, and national extrapolation is not supported.
Discovery bias. Press-led and press-release-led discovery over-represents services with enforcement action, warning notices or striking findings, which likely inflates severity relative to the full Requires Improvement population.
Uneven evidence. Depth ranges from one case coded from complete primary report text to six coded from brief council summaries. Where regulation numbers were absent, breaches were recorded in the source's own words rather than mapped to numbers, so the regulation counts in Figure 5 are a floor and not a frequency estimate. Regulation numbers were inferred for one case and are flagged as probable. Headline patterns were re-tested on the 12 best-evidenced cases and held or strengthened.
Coverage gaps. No extra-care housing or Shared Lives cases were captured, and supported living is represented by a single case. Reports span two regulatory frameworks; framework is recorded per case and findings normalised through the coding layer, but reports produced under different methodologies are not treated as directly comparable.
Where information was unavailable it is recorded as not stated. No statistic in this report has been estimated, interpolated or inferred from absent data.
Implications for the full study
The coding framework has now held across 82 findings without needing the Other category, and the severity, impact, cause and status fields continue to separate documentation risk from live risk cleanly. Four changes are recommended for the full study.
First, sample from the CQC ratings dataset and pull report text through the public reports API. The API returns complete reports and is the only route that removes both press-selection bias and the geographic distortion visible here.
Second, subdivide the governance code into audit absent, audit failed to detect, and audit detected but not actioned. The middle category dominates this sample and carries the most useful lessons for providers.
Third, add a distinct code for material change without governance re-baselining, covering new service, new cohort, rapid growth and leadership change.
Fourth, extend the deterioration cohort into a matched comparison. With enough cases on both sides, the question of what separates services that recover from those that decline becomes answerable rather than illustrative.
Early practical signals for providers
Offered as hypotheses to test at scale, not as findings. Audit your audits: the dominant failure is assurance that exists but does not detect, so the useful question is what your last three internal audits failed to find. Treat change as a risk event: re-baseline oversight whenever the service, cohort, scale or leadership changes. Close breaches with verified evidence, not action plans: nearly half this sample carried a breach forward, and at least one provider was recorded as having failed to follow its own plan. Do not read kindness as safety: Caring survived in almost every failing service here, so oversight needs measures that fail even when staff are kind. Expect movement: in this sample Requires Improvement rarely stayed still, and the deterioration route ran through unfixed original breaches.



Comments